

1. Anacondaのインストール
最初に、下記のサイトからAnacondaをインストールしてください
Advance AI with Open Source | Anaconda
Anaconda is the birthplace of Python data science. We are a movement of data scientists, data-driven enterprises, and op...
www.anaconda.com
2. Anaconda Powershell Prompt
Anaconda Powershell Prompt に以下を入力してください。Anaconda Powershell Promptは、アプリ一覧のAnacondaフォルダに入っています。
JavaScript
conda install r-base r-irkernel -y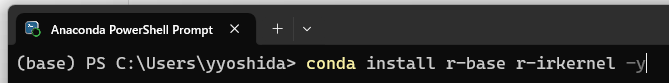
3. jupyter labの起動
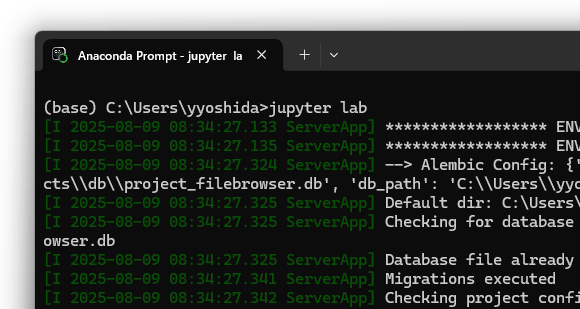
次にAnaconda Prompt または Anaconda Powershell Prompt に「jupyter lab」と入力します。Enterを押すと、jupyter lab が起動します。
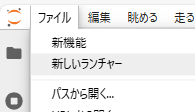
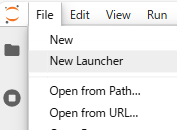
4. ファイルの開き方
ファイルから新しいランチャーを選択してください
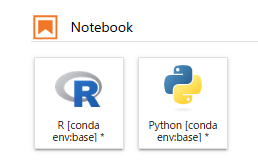
Notebookの R を選択してください
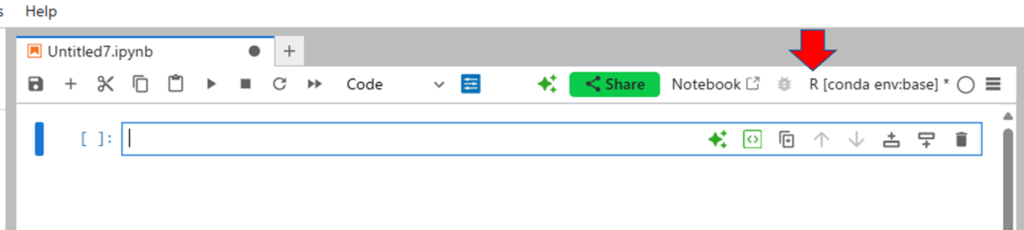
右側にRの表示が出れば成功です。Rになってますね!これでRを記述するファイルが開きました。以降は、赤矢印のところからPythonに切り替えもできます。
5. Rの実行
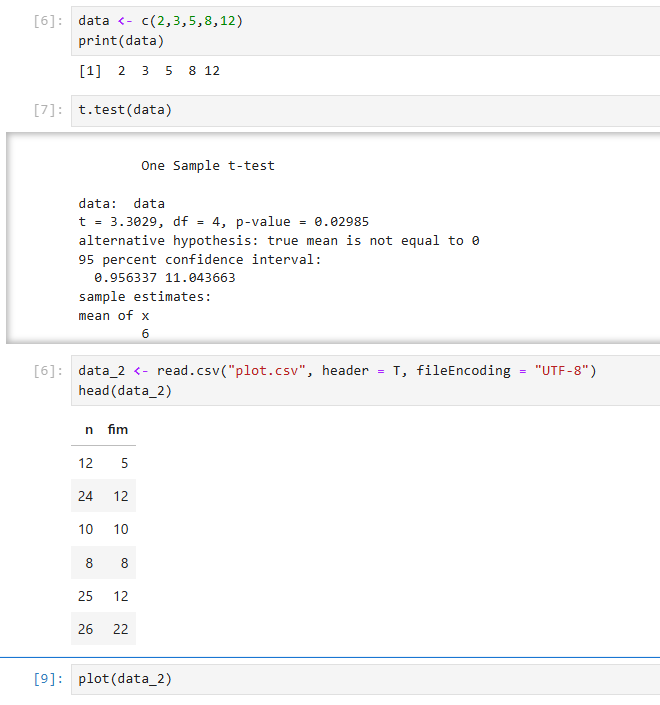
Rで少しやってみましょう。{2,3,5,8,12} の1標本t検定を実施してみましょう。
data <- c(2,3,5,8,12)
print(data)
t.test(data)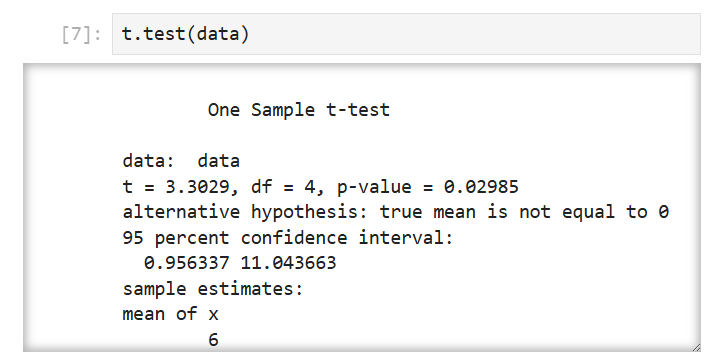
問題なく動きますね
6. ファイルの読み込み
次に作業ディレクトリを指定して、ファイルを読み込んでみましょう。ファイルの読み込みや以下のページを参照してください。

data_2 <- read.csv("plot.csv", header = T, fileEncoding = "UTF-8")
head(data_2)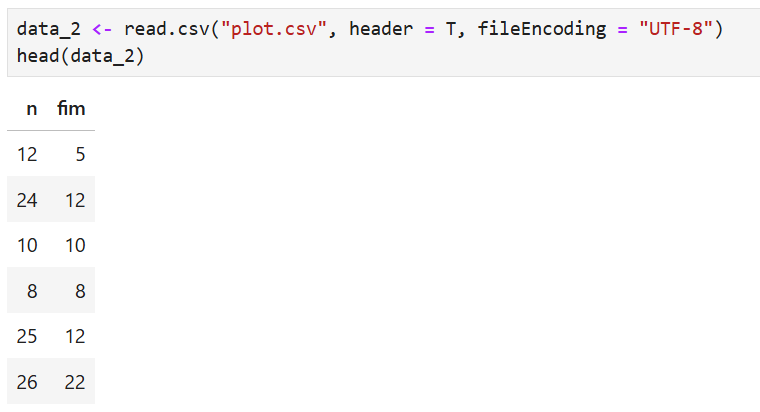
作図も可能です
plot(data_2)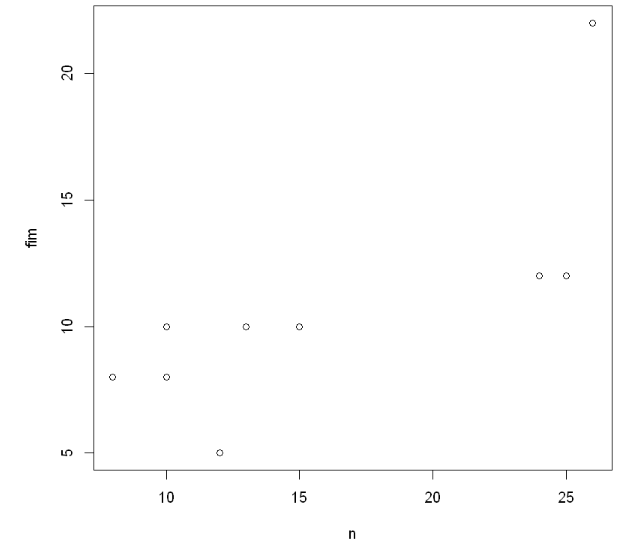
全体のイメージはこんな感じです