
前後の関連性
postをy軸、preをx軸にした散布図
R
# 散布図と回帰直線の描画
plot(
  data$pre, data$post,
  main = "散布図と回帰直線",
  xlab = "Pre", ylab = "Post",
  pch = 19, col = "blue"
)

# 回帰直線を引くためにlm関数を使用
# abline関数で描画
abline(lm(post ~ pre), col = "red", lwd = 2, data)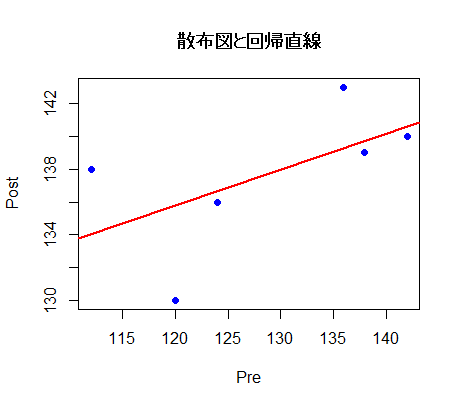
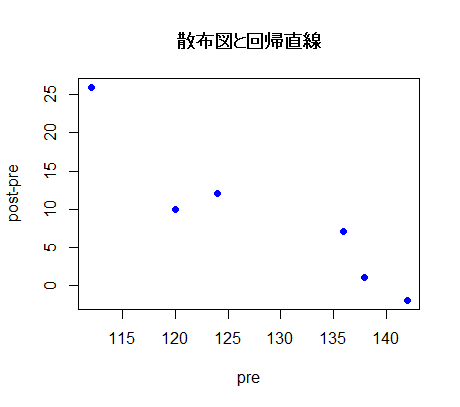
前後差をy軸、preをx軸にした散布図
R
y <- data$post - data$pre
# 散布図と回帰直線の描画
plot(
  data$pre, y,
  main = "散布図と回帰直線",
  xlab = "pre", ylab = "post-pre",
  pch = 19, col = "blue"
)
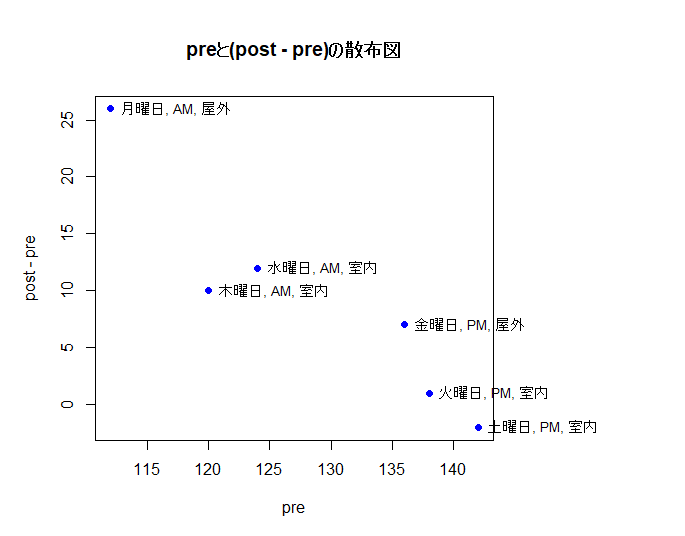
前後差をy軸、preをx軸にした散布図(他の変数の情報を追加)
R
#余白の調整
par(mar = c(5, 5, 5, 10))

# yをpost - preとする
y <- post - pre
x <- data$pre

# 散布図の描画
plot(
  x, y,
  main = "preと(post - pre)の散布図",
  xlab = "pre", ylab = "post - pre",
  pch = 19,
  col = "blue"
)

# day, time, placeの情報をラベルとして追加
text(
  x, y,
  labels = paste(data$day, data$time, data$place, sep = ", "),
  pos = 4, cex = 0.8,
  xpd = TRUE
)