サンプル
R
x <- seq(-3, 3, 0.1)
y <- dnorm(x) #平均0、分散1の標準正規分布の乱数
plot(x, y, type="l", ylab ="確率密度", xlab="")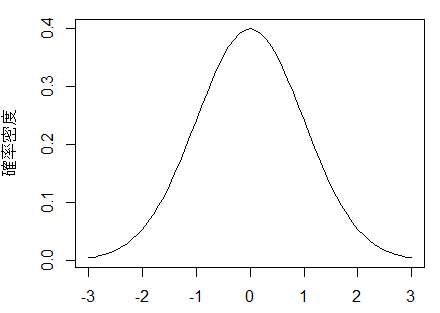
目盛りを書き換える(非推奨)
R
x <- seq(-3, 3, 0.1)
y <- dnorm(x) #平均0、分散1の標準正規分布の乱数

#xaxt="n"で軸を消去
plot(
    x, y,
    type="l",
    ylab ="確率密度", xlab="",
    xaxt="n")
#side=1:x軸
name <-c (0: 6)
axis(side=1, -3:3, labels=name)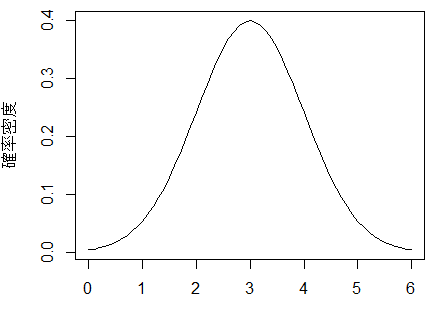
注意)単にX軸を書き換えるだけなので、データには元のN(0, 1)が入っています
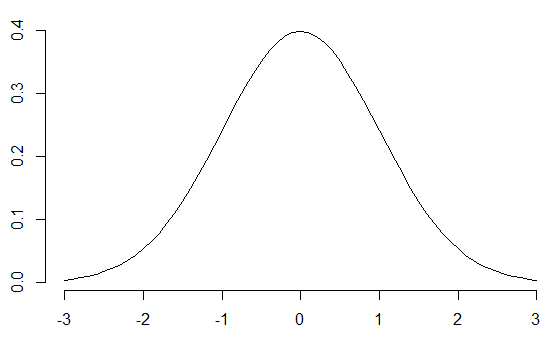
目盛りの書き換え
等分した目盛り
R
x <- seq(-3, 3, 0.1)
y <- dnorm(x) #平均0、分散1の標準正規分布の乱数
plot(x, y, type="l")
#xaxpでx軸の等分割
plot(x, y, xaxp=c(-3, 3, 4), type="l") 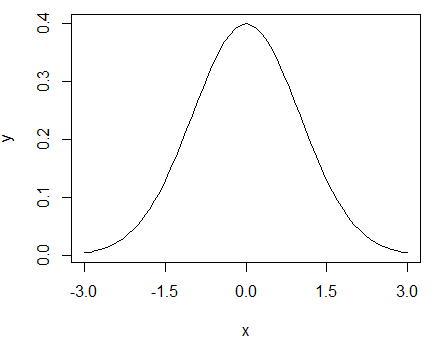
-3~0を四分割
R
x <- seq(-3, 3, 0.01)
y <- dnorm(x) #平均0、分散1の標準正規分布の乱数
plot(x, y, xaxp=c(-3, 0, 4), type="l")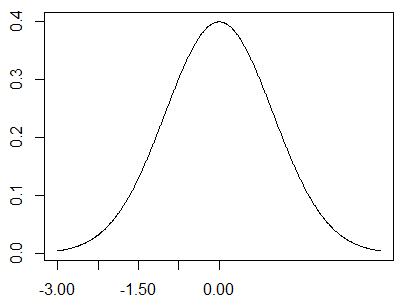
-1.5, 0, 3.0に”あ”, “い”, “う”を挿入
R
x <- seq(-3, 3, 0.01)
y <- dnorm(x) #平均0、分散1の標準正規分布の乱数

plot(x, y, xaxp=c(-3, 3, 4), type="l", xaxt="n")
name <- c("あ", "い", "う")
#指定した場所に挿入
axis(side=1, at=c(-1.5, 0, 3.0), labels=name)

#非推奨)単にX軸を書き換えるだけなので、データには元のN(0, 1)が入っています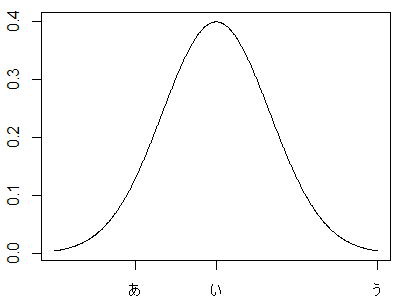
消す
上と右の枠を消す
R
x <- seq(-3, 3, 0.1)
y <- dnorm(x) #平均0、分散1の標準正規分布の乱数
plot(x, y, type="l", bty="n")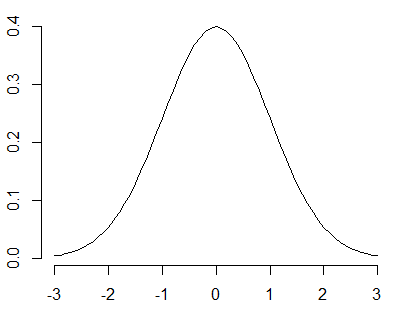
枠を消す+x軸も消す
R
x <- seq(-3, 3, 0.1)
y <- dnorm(x) #平均0、分散1の標準正規分布の乱数
plot(x, y, type="l", bty="n", xaxt="n")
#グラフを重ねるときに使うかも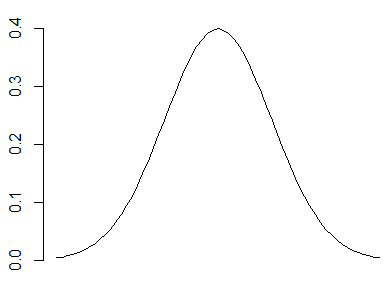
ついでにy軸も消したいとき
R
x <- seq(-3, 3, 0.1)
y <- dnorm(x) #平均0、分散1の標準正規分布の乱数
plot(x, y, type="l", bty="n", xaxt="n", yaxt="n")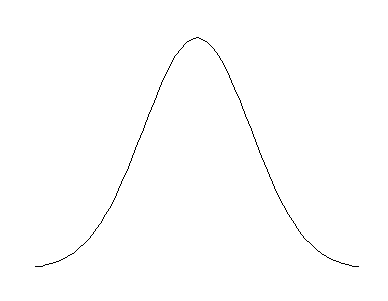
目盛りの向きを変更
R
x <- seq(0, 200, 1)
y <- dnorm(x, 100, 25) #平均100、分散25の正規分布の乱数
plot(x, y, type="l", las=2)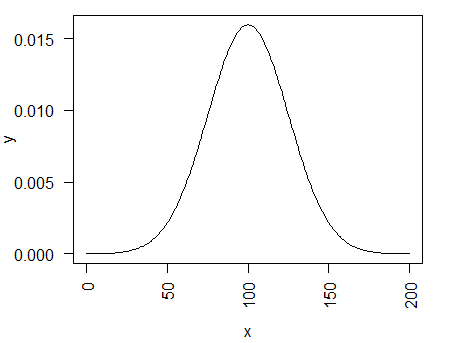
目盛りを自由に入れる
r-de-r様の助言をもとに修正 (2017.6.12)
N(300, 100^2)のグラフに目盛りを追加してみます
R
curve(dnorm(x, 300, 100),0 , 600)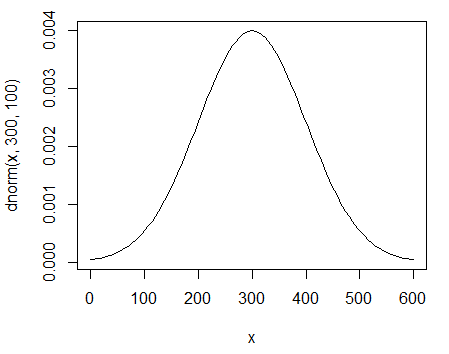
x軸に270と350を追加しています
R
axis(side=1, at=c(270, 350))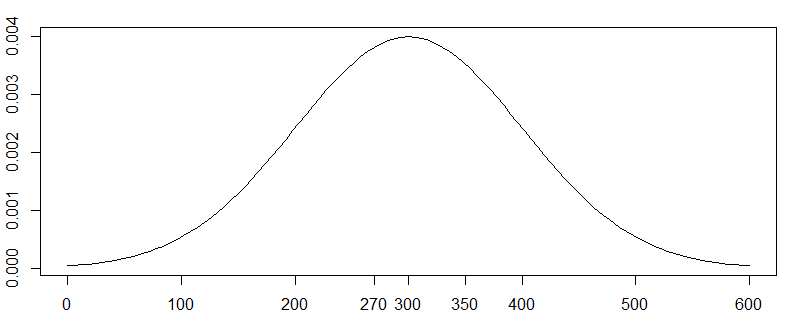
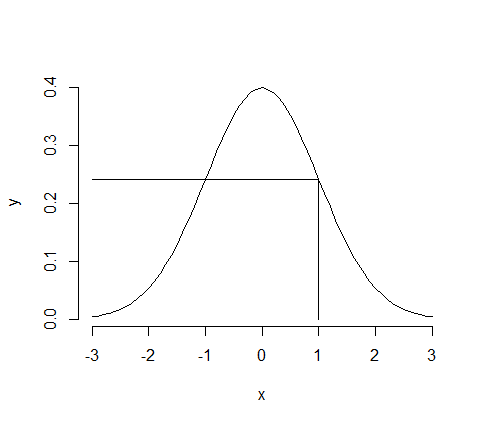
軸から線を描く
R
x <- seq(-3, 3, 0.1)
y <- dnorm(x) #平均0、分散1の標準正規分布の乱数
plot(x, y, type="l", bty="n")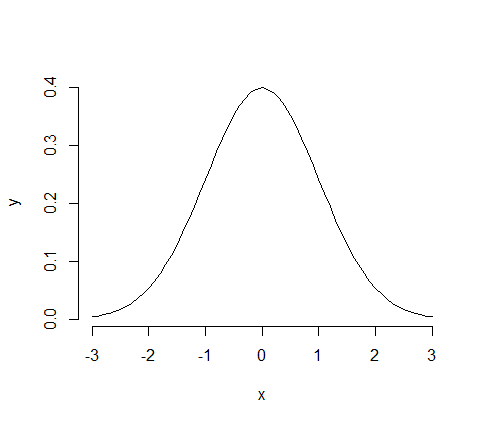
R
lines(c(1, 1), c(0, dnorm(1)))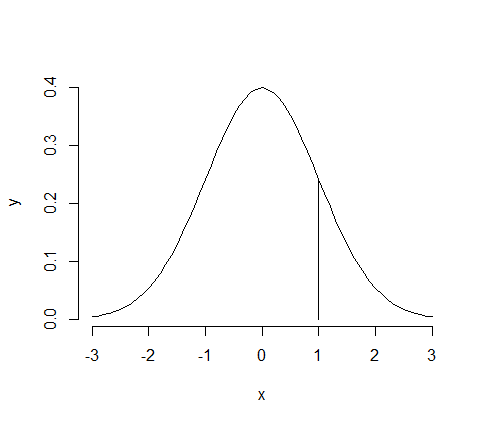
R
lines(c(1, -3), c(dnorm(1), dnorm(1)))