データセット set01 をdatに格納します(ファイルの読み込み)
R
data <- read.csv("set01.csv", header=T, fileEncoding = "UTF-8")データの確認
R
head(data)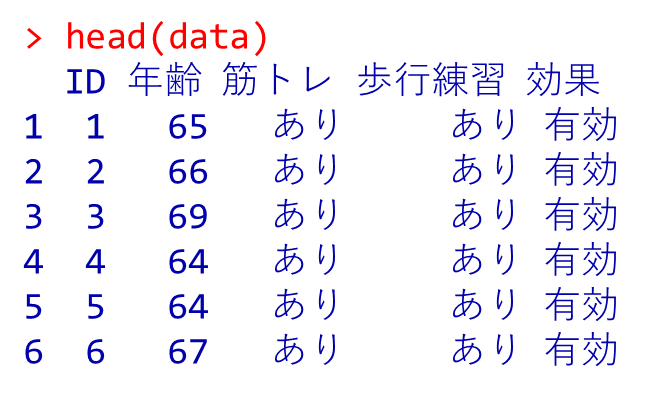
使用するパッケージ(パッケージのインストール)
R
library(tableone)一覧にしたい変数を選択してvarsの中に格納します
R
vars <- c( "年齢", "筋トレ", "歩行練習", "効果")次に名義変数を指定してfacvarsに格納します
R
facvars <- c("筋トレ", "歩行練習", "効果")表を作成します
R
table1 <- CreateTableOne(
    vars = vars,
    factorVars = facvars,
    data = data)

print(table1)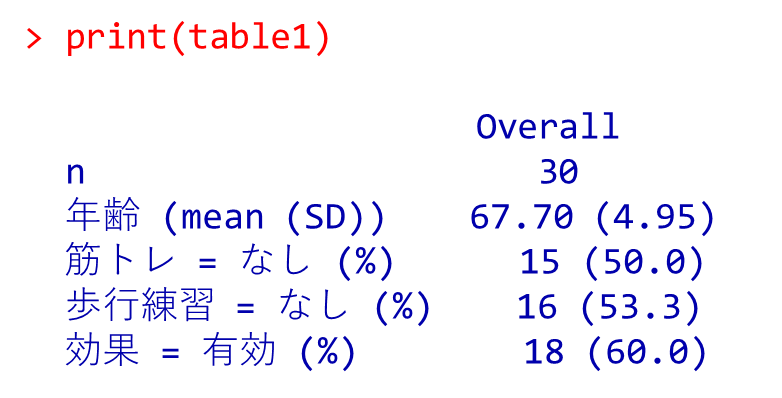
筋トレの有無で層別します
R
vars2 <- c( "年齢", "歩行練習", "効果")

table2 <- CreateTableOne(
    vars = vars2,
    factorVars = facvars,
    strata = "筋トレ",
    data = data)
比率の検定はFisherの正確検定(exact)
年齢をパラメトリック検定(oneway.test)で比較する場合
R
print(
table2,
normal = "年齢",
exact = c("歩行練習", "効果"))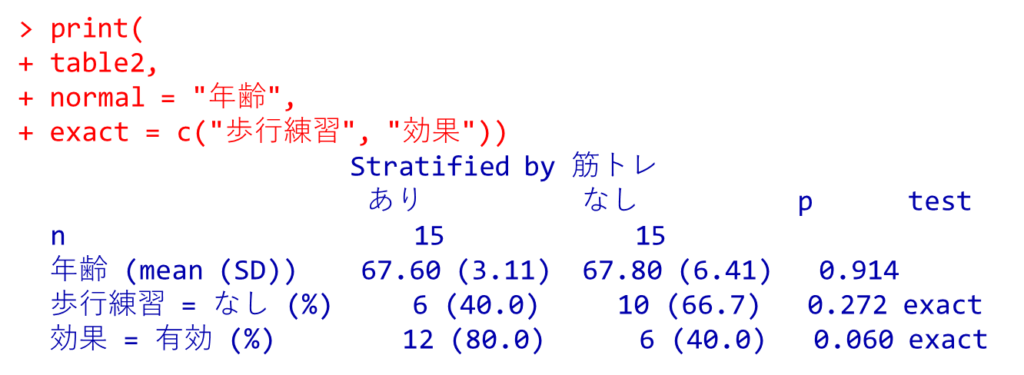
年齢をノンパラメトリック検定で比較する場合(Man-Whitney U test)
R
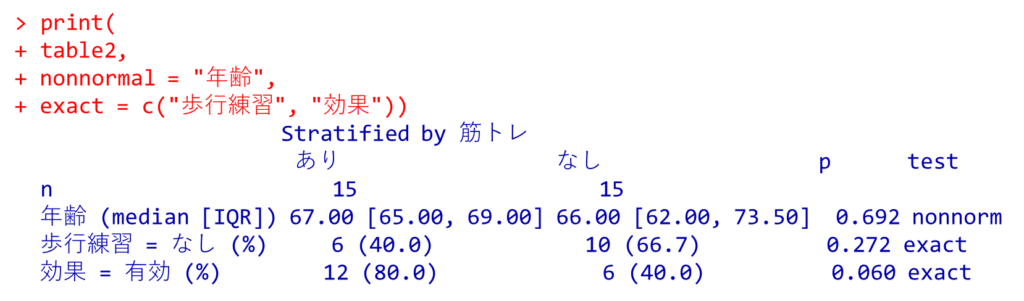
print(
table2,
nonnormal = "年齢",
exact = c("歩行練習", "効果"))
年齢[ ]の中は第1四分位と第3四分位