

作業フォルダを指定
必ず作業フォルダを指定しておいてください(ファイルの読み込み Step2 参照)

行と列
Rではデータをベクトルの形にして処理します.pre (治療前) というベクトル(列)を作ってみましょう.
R
pre <- c(112, 138, 124, 120, 136, 142)これを、Rにコピペしてみてください
>
> pre <- c(112, 138, 124, 120, 136, 142)
>
このようになったら、「治療前」というベクトルをRが認識したことになります.ちゃんと入っているか確認してみましょう.
R
print(pre)と入力してリターンをクリックしてください(print関数はなくても出力できます)
> print(pre)
[1] 112 138 124 120 136 142
Rは青文字で答えを返してくれます.これは、エクセルの列に該当します.
イメージはこんな感じです
R
View(pre)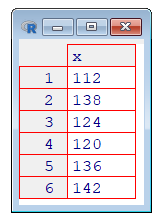
ベクトルは縦に並ばずに、横に並ぶので気持ち悪いかもしれませんが、慣れてください.横に並べたい場合は転置します.
R
t(pre)> t(pre)
[,1] [,2] [,3] [,4] [,5] [,6]
[1,] 112 138 124 120 136 142[1,]は1行目、[,1] は1列目を示します.よって、これは1行6列のことを意味しています.イメージはこんな感じです.
R
View(t(pre))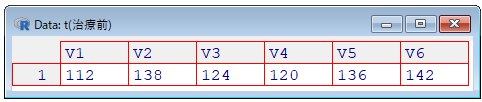
次に2列のデータセットを作ってみます(Rではデータフレームといいます)。イメージしやすくなります.data.frame関数で、2つのベクトルを合体させて2列のデータセットを作ります.dat という文字の中に2列からなるデータセットを格納します.
pre: 治療前
post: 治療後
R
pre <- c(112, 138, 124, 120, 136, 142)
post <- c(138, 139, 136, 130, 143, 140)
dat <- data.frame(pre, post)
print(dat)> print(dat)
pre post
1 112 138
2 138 139
3 124 136
4 120 130
5 136 143
6 142 140イメージ
R
View(dat)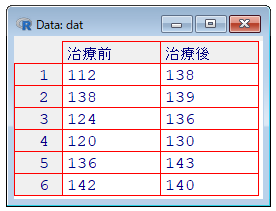
列の追加
dat というデータセットの中に性別というベクトル(列)を追加します.$は「~の中に」とか「~の中の」とか・・・いうイメージです.
R
dat$sex <- c("male", "male", "female", "male", "female", "female")
print(dat)> print(dat)
pre post sex
1 112 138 male
2 138 139 male
3 124 136 female
4 120 130 male
5 136 143 female
6 142 140 femaleR
View(dat)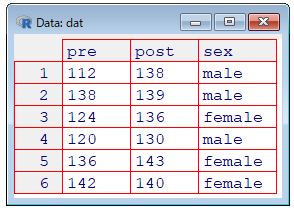
要約
summary関数でデータセットの要約を出力できます
R
summary(dat)> summary(dat)
pre post sex
Min. :112.0 Min. :130.0 Length:6
1st Qu.:121.0 1st Qu.:136.5 Class :character
Median :130.0 Median :138.5 Mode :character
Mean :128.7 Mean :137.7
3rd Qu.:137.5 3rd Qu.:139.8
Max. :142.0 Max. :143.0 性別がcharacterになっているので、factorに変更します
R
dat$sex <- factor(dat$sex)
summary(dat)性別の詳細を出力してくれます
> summary(dat)
      pre             post           sex
 Min.   :112.0   Min.   :130.0   female:3
 1st Qu.:121.0   1st Qu.:136.5   male  :3
 Median :130.0   Median :138.5
 Mean   :128.7   Mean   :137.7
 3rd Qu.:137.5   3rd Qu.:139.8
 Max.   :142.0   Max.   :143.0