
library(ggplot2)
data <- c(rnorm(n=100, mean=5, sd=1),rnorm(n=100, mean=3, sd=3))
cat <- c(rep("x",100), rep("y",100))
dat1 <- data.frame(cat, data)
colnames(dat1) <- c("name","value")
#乱数なのでデータは変わります
単純なヒストグラム
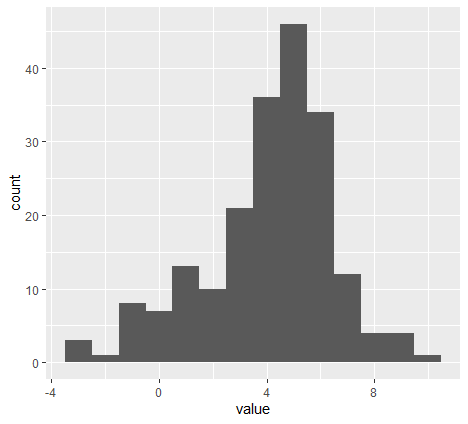
HG1= ggplot(dat1, aes(x = value)) +
geom_histogram(binwidth = 1)
plot(HG1)
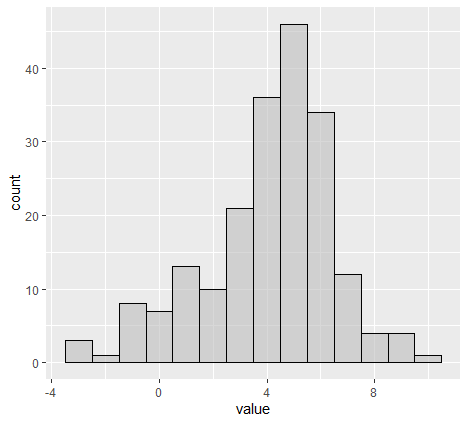
color=枠、fill=塗りつぶし、alpha=透かし (0-1)
HG2= ggplot(dat1, aes(x = value)) +
geom_histogram(binwidth = 1, color="black", fill="grey", alpha=0.6)
plot( HG2 )
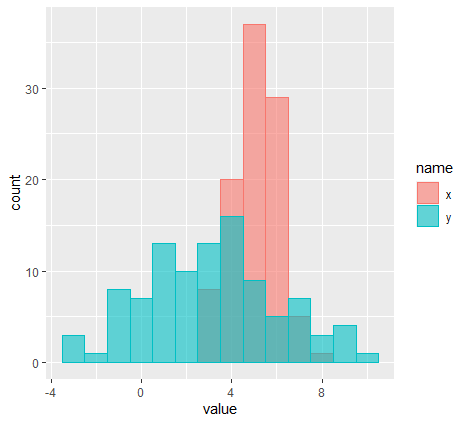
各グループで色分け、凡例の位置(position)
HG3= ggplot(dat1, aes(x = value, color = name, fill =name)) +
geom_histogram(position = "identity", binwidth = 1, alpha=0.6)
plot(HG3)
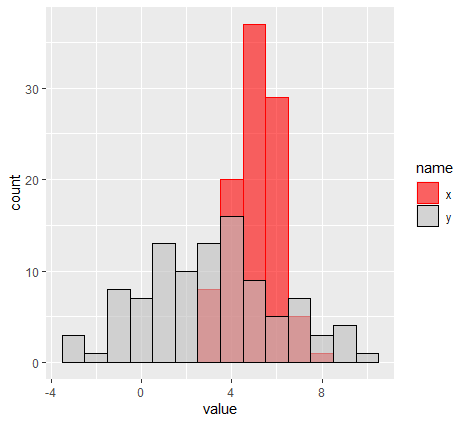
枠と塗りつぶしの色を変更
HG4= HG3 + scale_color_manual(values = c("red", "black")) +
scale_fill_manual(values = c("red", "grey"))
plot(HG4)
背景の操作1
HG5= HG4 + theme_bw()
plot(HG5)

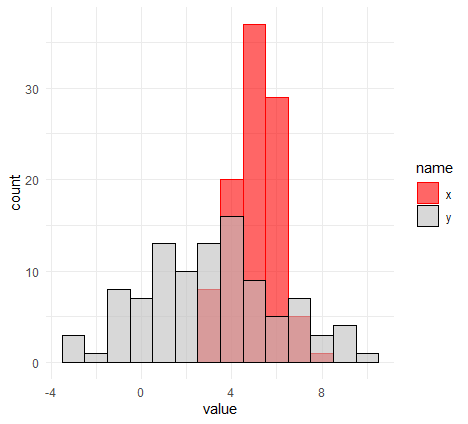
背景の操作2
HG6= HG4 + theme_void()
plot(HG6)

背景の操作3
HG7= HG4 + theme_minimal()
plot(HG7)
背景の操作4
HG8= HG4 + theme_classic()
plot(HG8)
