
注意)乱数を使用したシミュレーションです(10000回)。
R
set.seed(123) # 乱数のシードを設定
simulate_payment <- function() {
bills_in_cashier <- 0 # レジ内の千円札の枚数
bills_needed <- 0 # 準備する千円札の枚数(不足分は負の値)
for (i in 1:10) {
r <- sample(1:10, 1) # 1以上10以下の乱数を生成
if (r <= 3) {
# 1000円札6枚で支払う(30%)
bills_in_cashier <- bills_in_cashier + 6
} else {
# 1万円札1枚で支払う(70%)
if (bills_in_cashier >= 4) {
# お釣りを渡せる
bills_in_cashier <- bills_in_cashier - 4
} else {
# お釣りが足りない場合、不足分を計上
shortage <- 4 - bills_in_cashier
bills_needed <- bills_needed - shortage # 不足分をマイナス計上
bills_in_cashier <- 0 # すべての千円札を渡す
}
}
}
return(bills_needed)
}
# 10000回のシミュレーション
num_simulations <- 10000
results <- replicate(num_simulations, simulate_payment())
# 結果の分布をヒストグラムで表示
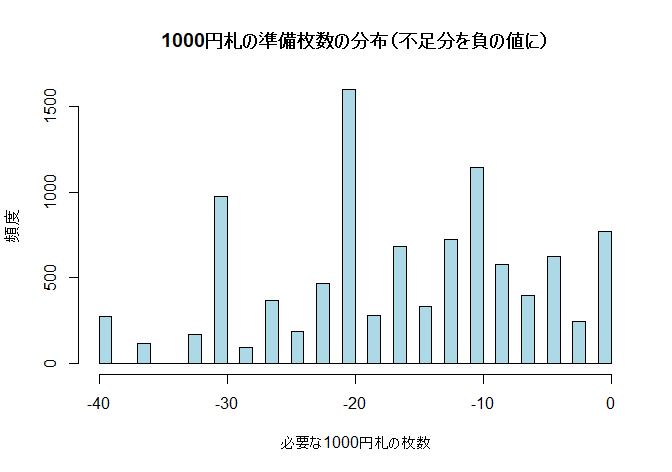
hist(results, breaks=30, col="lightblue", main="1000円札の準備枚数の分布(不足分を負の値に)",
xlab="必要な1000円札の枚数", ylab="頻度")
# 結果の要約統計量を表示
summary(results)