
R
library(tidyr)
library(ggplot2)
縦持データに変換
R
dat2 <- tidyr::gather(
    dat,
    key=method,
    value=range,
    -age)
head(dat2)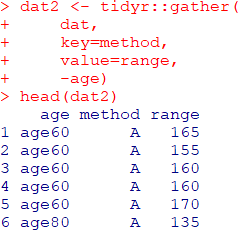
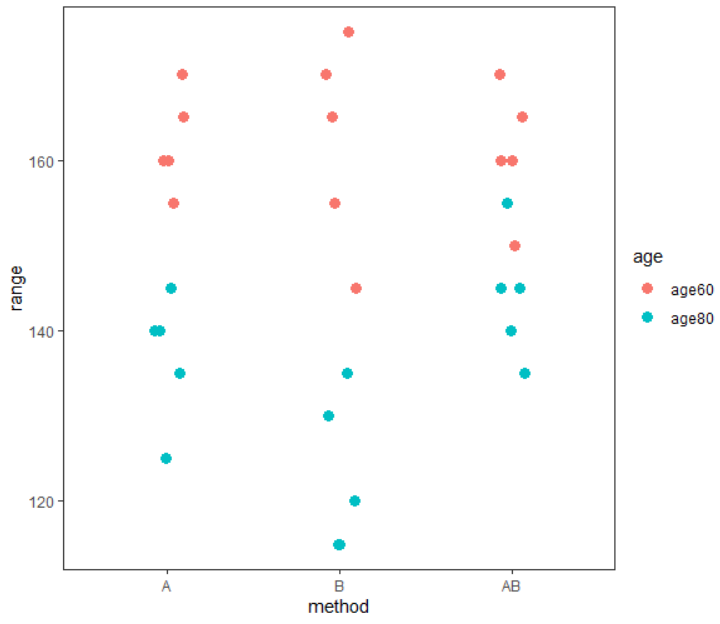
このまま描いたらA→AB→Bの順に並ぶのでレベルを並び替えます
R
dat2$method <- as.factor(dat2$method)

#これでレベルが付与されました
levels(dat2$method)

#transform関数でレベルを入れ替えましょう
dat3 <- transform(
    dat2, method = factor(
        method, levels = c("A", "B", "AB")
        )
)

#これでレベルの順序が変更されているか確認
levels(dat3$method)

#グラフの描き方、dat2をdat3に変更して再度描きなおします
g1 <- ggplot2::ggplot(
    dat3,
    aes(x = method, y = range)
)

(g2 <- g1 + geom_jitter(
    height=0, width =0.1, size = 3, aes(colour = age)
) + theme_test())
x軸は、A→B→ABの順に並んでいます